> For the complete documentation index, see [llms.txt](https://docs.fastn.ai/llms.txt). Markdown versions of documentation pages are available by appending `.md` to page URLs; this page is available as [Markdown](https://docs.fastn.ai/operate/alerts.md).
# Alerts
Get told when something crosses a line you care about. Checked every 15 minutes.
**Activity → Alerts**
Turn on failure alerts creates the two alerts most teams need in one click.
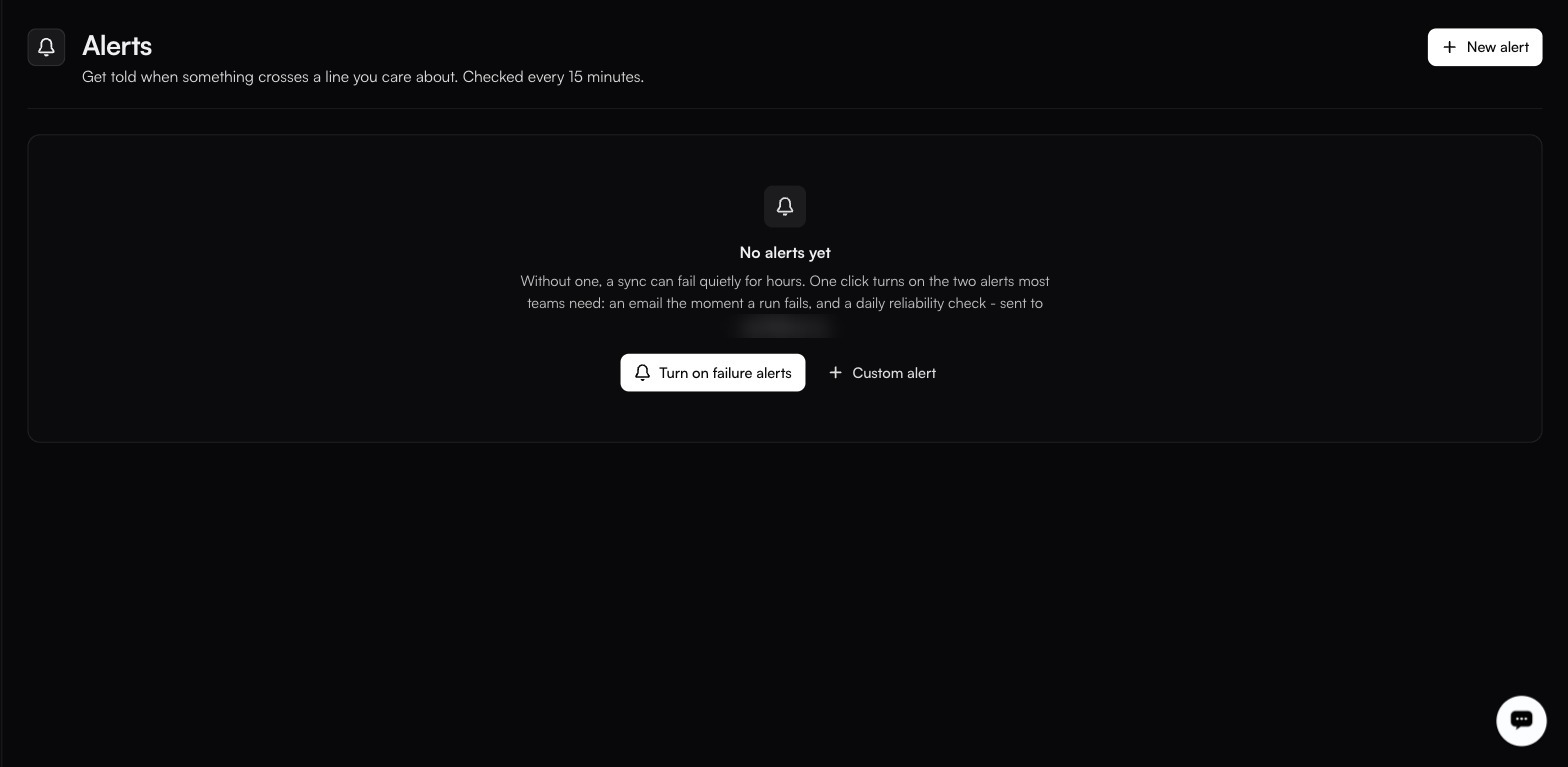
Without an alert, a sync can fail quietly for hours. This is the cheapest insurance in the product. The empty state says as much:
> Without one, a sync can fail quietly for hours. One click turns on the two alerts most teams need…
under the heading **No alerts yet**, with **Turn on failure alerts** and **Custom alert** beside it. It names the address the two alerts would go to: the email you signed in with. **New alert** sits top-right, and the empty state is the whole page until an alert exists.
### The one-click start
**Turn on failure alerts** creates the two alerts most teams need in one click: an email the moment a run fails, and a daily reliability check. If you do nothing else on this page, do that.
### Custom alerts
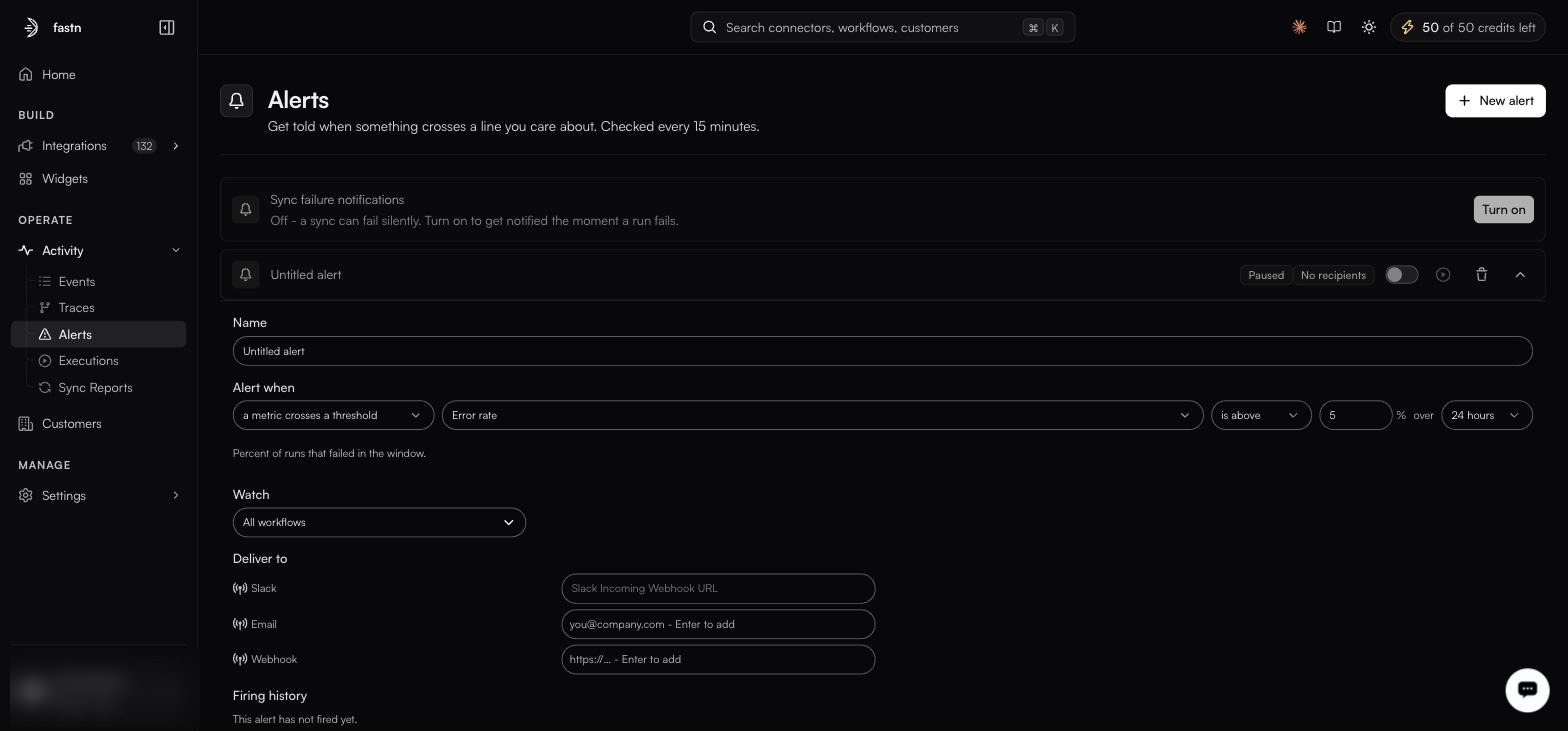
Firing history at the bottom reads This alert has not fired yet.
**New alert** (or **Custom alert** on the empty state), opens the editor.
{% hint style="danger" %}
**The editor autosaves, and there is no Save button.** **New alert** persists an alert on the server the moment you click it (an `Untitled alert`, **Paused**, with **No recipients**) and every subsequent edit is saved as you make it. There is nothing to confirm and nothing to cancel. If you opened one by accident, delete it from its row; closing the editor leaves it behind.
{% endhint %}
#### Alert when
Two shapes. **a metric crosses a threshold** is the default.
* **a run fails (instant)**: fires on the failure itself.
* **a metric crosses a threshold**: fires when a measured value goes above or below a number, over a window. The default.
#### Metrics
**Error rate** is the default.
| Metric | Measures | Unit |
| ---------------------- | ------------------------------------------------ | ----- |
| **Error rate** | Percent of runs that failed in the window. | % |
| **Success rate** | The inverse. | % |
| **Failed runs** | Count of failures. | count |
| **Total runs** | Count of runs: catches a source that went quiet. | count |
| **Records synced** | Volume moved. | count |
| **Records failed** | Records rejected downstream. | count |
| **Avg run time** | Mean duration. | time |
| **p95 run time** | Tail latency. | time |
| **Broken connectors** | Connectors with failing connections. | count |
| **Inactive workflows** | Workflows that have stopped running. | count |
Each takes **is above** or **is below**, a value, and a window of **1 hour**, **24 hours**, **7 days** or **30 days**.
{% hint style="warning" %}
Watch the unit when you type a threshold. The default alert is **Error rate is above 5**: five *percent*. Switch the metric to **Failed runs** and the same 5 means five *runs*, which on a busy workspace is a far tighter trigger than it looks.
{% endhint %}
**Defaults on a new alert:** **a metric crosses a threshold**, metric **Error rate**, comparator **is above**, threshold **5%**, window **24 hours**.
#### Watch
A multi-select: leave it across everything, or pick the specific workflows this alert applies to. Scope noisy metrics narrowly; a global error-rate alarm on a workspace with one flaky test workflow trains you to ignore it.
#### Deliver to
| Channel | Configure |
| ----------- | ------------------------------ |
| **Slack** | An incoming webhook URL. |
| **Email** | One or more addresses. |
| **Webhook** | An HTTPS endpoint of your own. |
An alert with no recipients shows **No recipients** and will not notify anyone.
#### Firing history
Each alert keeps a record of every time it fired: the fastest way to tell a real signal from a threshold set too tight. On a new one it reads `This alert has not fired yet.`
### Evaluation
Threshold alerts are evaluated every 15 minutes. Run-failure alerts are instant.
### A starting set
| Alert | Why |
| ------------------------------------------------- | ----------------------------------------------------- |
| A run fails → email + Slack | The baseline. |
| Error rate above 5% over 1 hour | Catches degradation before it is total. |
| Total runs below 1 over 24 hours, on a daily sync | Catches a schedule that silently stopped. |
| Broken connectors above 0 | Catches expired credentials before the customer does. |
---
# Agent Instructions
This documentation is published with GitBook. GitBook is the documentation platform designed so that both humans and AI agents can read, navigate, and reason over technical content effectively. Learn more at gitbook.com.
## Querying This Documentation
If you need additional information that is not directly available in this page, you can query the documentation by asking a question.
Perform an HTTP GET request on the following URL with the `ask` and `goal` query parameters:
```
GET https://docs.fastn.ai/operate/alerts.md?ask=&goal=
```
`ask` is the immediate question: it should be specific, self-contained, and written in natural language.
`goal` is what the user is ultimately trying to achieve, the reason they need the answer. Sharing it helps GitBook give you a better, more relevant answer. A goal is most helpful when it describes the outcome the user wants rather than restating the question. For example, with `ask=how do I create an API token`, a goal like `automate deployments from our CI pipeline` lets GitBook tailor the answer to that use case.
The response will contain a direct answer to the question and relevant excerpts and sources from the documentation.
Use this mechanism when the answer is not explicitly present in the current page, you need clarification or additional context, or you want to retrieve related documentation sections.